

A slow website never shows you an error message. It simply brings in fewer customers than it could, and you never find out how many people hit the back button before they saw anything of you at all.
The good news: this is one of the most measurable things in your entire online presence. Google has been publishing exactly what it considers good for years, gives you a free tool to measure it, and even shows you what is slowing down your specific site.
In this article we walk through how much speed is worth in real money, what the three official metrics mean, how to measure them in five minutes, and in what order it makes sense to start fixing things. And at the end, we give you an honest answer to the question of whether Google really ranks you for this.
How much is 0.1 seconds worth?
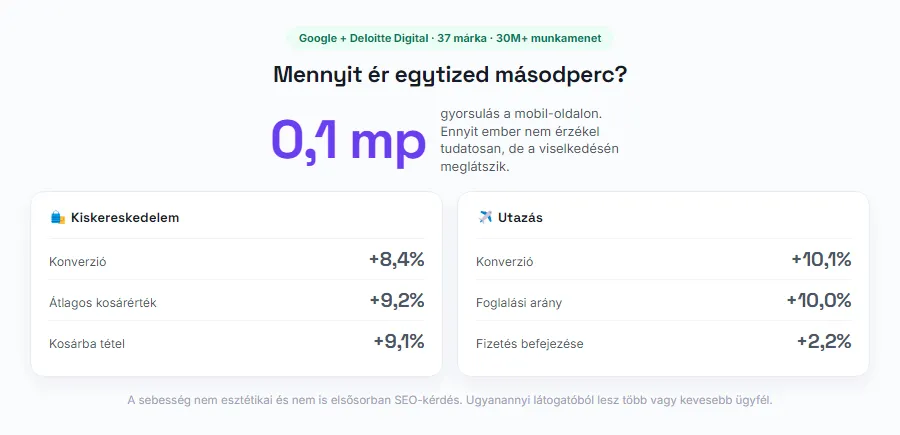
There is a concrete number for this. Commissioned by Google, Deloitte Digital studied the mobile sites of 37 leading European and American brands over four weeks and more than 30 million sessions. They looked at what happens when a page gets just one tenth of a second faster.
In retail, conversions rose by 8.4% and average order value by 9.2%. On travel sites, conversions climbed by 10.1%. The effect showed up at every step of the purchase journey: moving from a product listing to a product page became 3.2% more frequent, and adding to cart 9.1% more frequent.
One tenth of a second. An amount of time no human consciously perceives, yet it still shows up in behavior. This is the most important thing to know about speed: it is not a question of aesthetics, and not primarily an SEO question either. It is a revenue question.
The three metrics, in plain language
Under the name Core Web Vitals, Google measures three things, and each one describes a different stage of your visitor's experience. It is three for a reason: the start of loading, the middle, and actual usage break in different ways.
LCP, or when the main content appears. It measures how long it takes for the largest content element to render, which is typically the hero image or the main headline. From the visitor's point of view, this is the “finally, it loaded” moment. A good value: 2.5 seconds or less.
INP, or how quickly it responds. You tap the menu or a button, and some amount of time passes before anything happens on screen. A good value: 200 milliseconds or less. This metric replaced the old FID in March 2024, and it is stricter: it looks not only at the first interaction but at the slowest ones across the entire visit.
CLS, or how much the layout jumps around. That moment when you are about to click something, but an image or an ad loads and pushes it out of the way. A good value: below 0.1. On mobile this is the most annoying one, and it almost always traces back to a single cause: the image has no space reserved for it in advance.
One detail that misleads a lot of people: Google does not look at the average, but at the 75th percentile, measured separately for mobile and desktop. In other words, what matters is not whether the site is fast for you, but whether the threshold is met for at least three quarters of your visitors.

Where the web stands, and where you stand
It helps to know what to compare yourself to. According to the HTTP Archive Web Almanac 2025 survey, 48% of websites on mobile and 56% on desktop pass all three thresholds. In other words, roughly every second site fails on mobile.
The per-metric breakdown shows where the weak spot is. On mobile, 77% of sites pass INP and 81% pass CLS, but only 62% pass LCP. On desktop, INP is practically a solved problem (97%), while LCP is the weakest there too (74%).
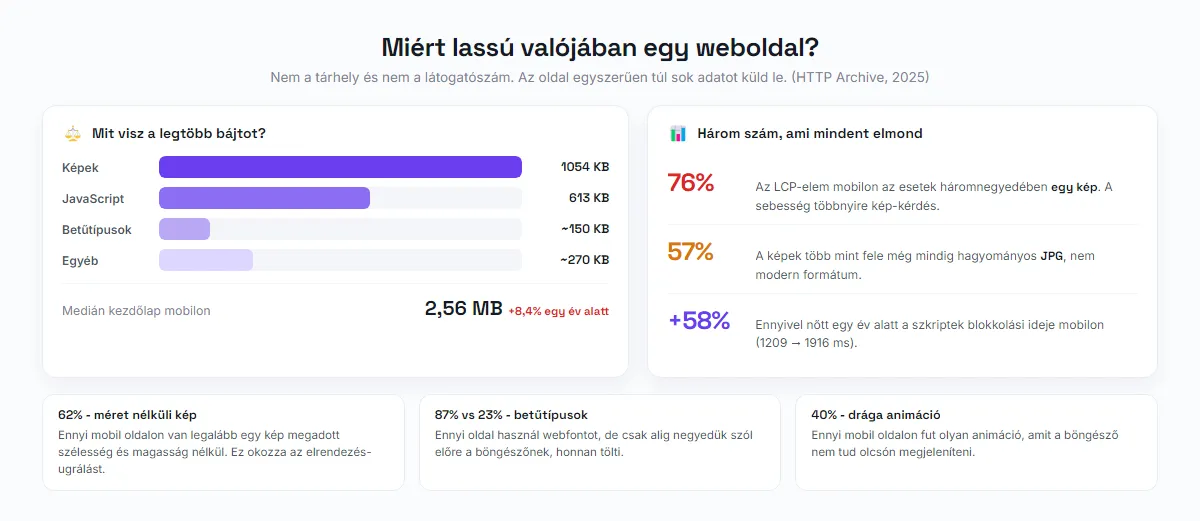
This number saves you from unnecessary work. If your site is slow, the odds are very high that the problem is not click responsiveness, but when anything appears on screen at all. And since the LCP element on mobile is an image in 76% of cases, on most sites the question of speed is really a question of images.
How to measure it in five minutes
You need two free tools, both from Google. The first is PageSpeed Insights: you type in a URL and get a report. There is an important trap here worth understanding.
The top block of the report is real user data (anonymous measurements from Chrome browsers over the past 28 days). The bottom block is a lab test: a single load on a simulated device. The two regularly disagree, and Google uses the top one, the real one. If you only look at the lab score, you can easily end up working with the wrong numbers.
The second tool is the Core Web Vitals report in Search Console, which shows not just one URL but your whole site, organized into URL groups. This is what tells you whether the problem affects a single page or your entire template. If you have not connected it yet, we wrote a separate guide: Search Console guide.
Always measure in mobile view, and do not judge from your office wifi. Most of your visitors arrive on weaker phones, over mobile data, and that is how Google measures them too.
Why is it actually slow?
The most common cause is not what you would first think. Not the hosting, not WordPress, and not “all the traffic” either. It is simply that the page sends down too much data.
The median homepage in 2025 is 2.56 MB on mobile, and that grew by 8.4% in a single year. Most of those bytes go to images: on desktop pages, 1054 KB of images versus 613 KB of JavaScript. On top of that, 57% of images are still in the traditional JPG format, even though modern WebP typically delivers the same image at a much smaller size.
The second big item is scripts. Every plugin, chat widget, embedded map, social button and tracking code brings its own network requests and its own JavaScript. And this number is getting visibly worse: the median Total Blocking Time on mobile grew by 58% in one year, from 1209 milliseconds to 1916. Pages did not get richer, just heavier.
The third, and the easiest to fix: images without dimensions. 62% of mobile pages have at least one image with no width and height specified. The browser then cannot reserve its space in advance, so when the image arrives, it shoves the text out of the way. That is CLS, and a few lines of fixes make it disappear.
Finally, fonts: 87% of pages use web fonts, but barely a quarter of them tell the browser in advance where they will be downloaded from. That is a few hundred milliseconds you could avoid for free.
What to do, in order of importance
Speed projects usually stall because everyone tries to do everything at once. But the payoff is very unevenly distributed: the first two steps deliver the vast majority of the improvement.
1. Images. Start here, this is where the most savable bytes are. Convert them to a modern format, and even more importantly: do not upload a 4000-pixel-wide photo into an 800-pixel slot. Give every image a width and a height, lazy-load the ones below the fold, but never the hero image, because that is precisely the LCP element.
2. Fewer scripts. Go through how many plugins are running on your site and how many you actually use. An abandoned slider plugin or an old social module keeps loading even if not a single visitor ever sees it.
3. Caching and compression. Turning on static caching and compression is typically a configuration task, not a development task, and the effect is immediate.
4. Hosting. Cheap, overloaded hosting shows up in server response time, which is the very first stage of LCP. It does not matter how much you optimize everything after that if the first byte takes seconds to arrive.
5. Fonts. Fewer font weights, and tell the browser in advance where to load them from.
6. Nothing should jump around. Every image, ad and embed should have its space reserved in advance.

When will you see the results?
This is the part that tends to disappoint, so it is worth knowing up front. The lab test shows the improvement immediately: you convert your images, run the test again, and the score is better right away.
Real user data, however, moves in a 28-day rolling window. That means today's fix gets blended with the past four weeks of old data in today's measurement, and it only clears up gradually. If you check Search Console a week after the fix, chances are you will barely see any change, even though everything is already in order.
A realistic expectation: in the lab, immediately; in Search Console, you see the full effect after 3-4 weeks.
And does Google really rank you for this?
Yes, but not the way the sales pitches suggest. Core Web Vitals is part of Google's evaluation, but it is a much weaker signal than how well your content answers the search. A fast page with poor content will not outrank a slow page that delivers exactly what the searcher was looking for.
The realistic picture: speed is more of a tiebreaker. If two of you give similarly good answers, the faster one moves ahead. It also works indirectly, because fewer people immediately bounce from a fast page.
That is why we do not promise a ranking jump from speed alone. What can be promised is in the Deloitte numbers: more leads from the same number of visitors. We covered the other ranking factors in our SEO 2026 article, and when it is worth touching your site at all in the website redesign guide.
Frequently asked questions
What counts as a good loading time?
Why do PageSpeed Insights and Search Console show different numbers?
Does Google rank sites based on speed?
Is installing a speed-up plugin enough?
Why did it get slower when I haven't touched it?
📚 Sources
Not sure where your site stands?
Our free SEO analyzer checks your site, gives it a score, and lists concrete action items, from speed to technical settings. After signing up it takes just a few seconds, and you don't need to be a developer.
Start your free analysis →